IT Experience Whiteboard Video Series: Part Two
Part Two of a Three-part blog series about planning with IT User Experience data: how to prioritize IT services which are having the greatest impact on the business.
With so many demands on enterprise IT, it can be difficult to know what to prioritize.
In part 1 of this series, we explained why bringing in the perspective of the people that use IT services (IT Experience data) leads to better decision-making.
To understand what IT’s priorities should be, we need to consider two dimensions of experience:
- Satisfaction (how well services are performing)
- Influence* (what services people care most about)
*aka Impact
Calculating Influence Score
Most people are familiar with Satisfaction Score, however Influence Score is an entirely new concept for most.
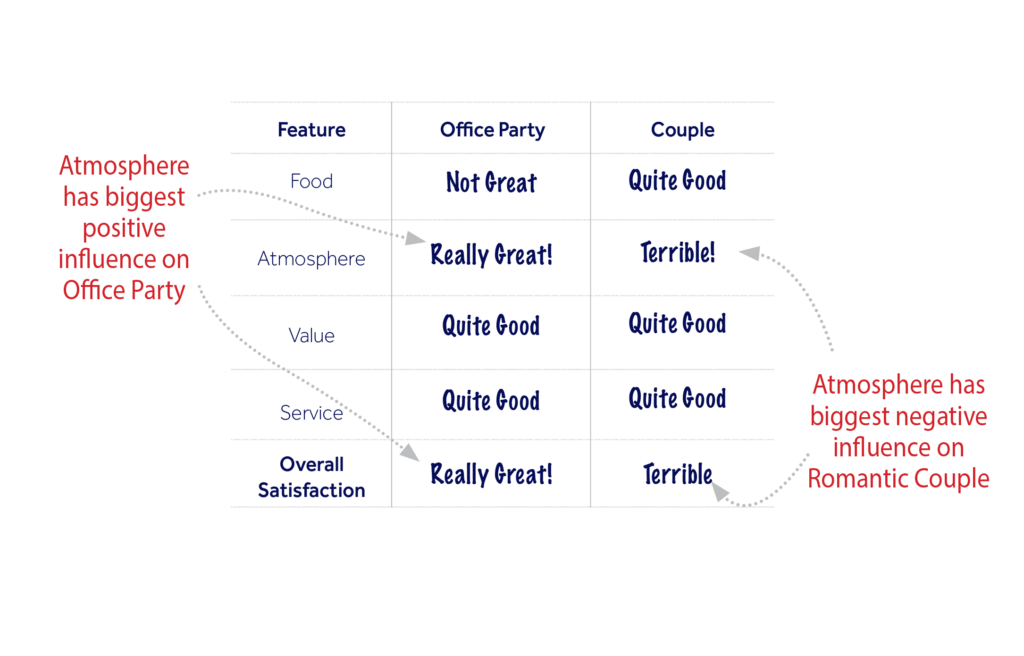
A useful analogy to explain Influence Score is as follows: let’s say you run a restaurant and you want to understand what contributes most to the overall experience of different types of diners.
You ask two groups of people what was their overall experience: co-workers attending an Office Party say it was “Really Great”, while a Romantic Couple on a date-night say it was “Terrible”.
You want to understand what in particular made each of these groups have such a different overall experience, so you ask a few more questions.
- The food? Not great for the Office Party, but quite good for the Romantic Couple.
- The Atmosphere? Really great for the Party thanks to the loud music and sing-songs, but terrible for the Couple because of the noise-levels.
- Value and Service? quite good for both.

Each group wanted different things, and it is clear that the Atmosphere was a very important feature of their visit (high Influence). The restaurant can benefit from this learning by taking actions in future such as seating couples in a quieter room, or targeting more parties for weekend nights.
You can do the same for IT services to understand what services are having the greatest impact on overall IT experience, so you can prioritize more effectively.
Map out IT Services on the Prioritization Matrix
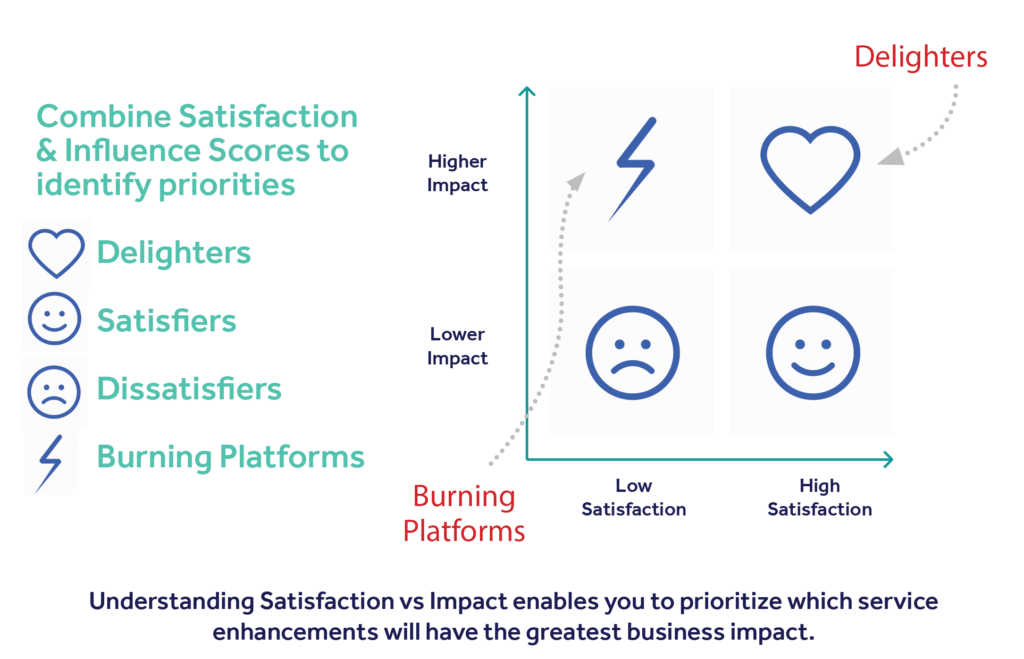
Plotting these two scores for each IT service (“Satisfaction” vs “Influence”) on a prioritization matrix allows you to fully visualize how different IT services are performing in a way that reflects their relative impact on the business.
- Delighters: High performing Services in the top right quadrant should be celebrated & rewarded within IT, and communicated across the business to celebrate quality service delivery.
- Satisfiers: services in the bottom right are performing well, but need to be monitored and managed to maintain this good performance over time.
- Dissatisfiers: a small nudge to IT Services in the lower left of the grid may be all that is needed. Education & communication can bring outsized returns. However, if neglected they can escalate.
- Burning Platforms: Poorly performing IT services in the top left quadrant are having the greatest negative business impact and need urgent attention.
This enables you to quickly understand which services should be prioritized, brings the IT team into alignment, and helps you shape your IT roadmap.

Dynamic IT: keep track of changing priorities over time
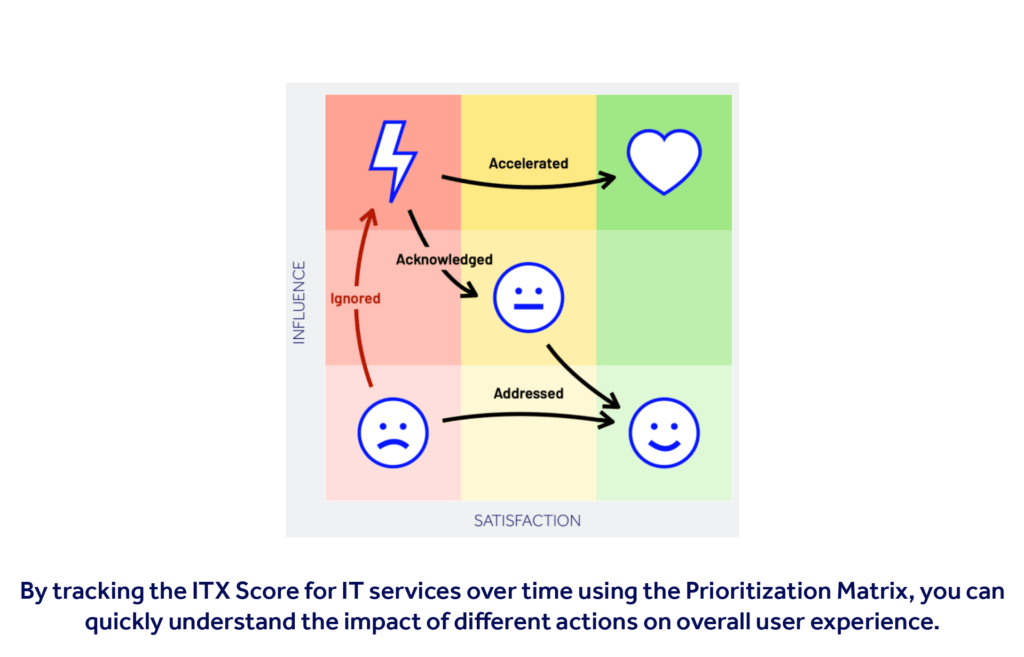
By tracking both the Satisfaction and Influence Score for IT services over time using the Prioritization Matrix, you can quickly understand the impact of actions taken on overall user experience.
For example, if a service that scores low for both Satisfaction and Influence (bottom left) is ignored, it may escalate into a “burning platform” issue over time (moves to top left). This often leads to outsized costs and significant business impact.

Similarly, we have seen that by simply acknowledging major “burning platform” issues (low Satisfaction and high Influence – top left) and communicating a clear action plan to address them, the ITX Score for that service improves in subsequent surveys, building trust with stakeholders while creating space for IT to address the issue.
—-
If you haven’t gathered comprehensive IT Experience metrics before, you can get started by downloading our IT Budget Planning Toolkit. It provides practical frameworks and a simple IT Experience Calculator you can use to ground your IT action plan in business terms, focused on the needs of end-users across your organization.
Article by Steve Fleming, Founder and CEO Voxxify.


